Messpunktlage Diagramm in einer Zeile mit Höhe 15
17.12.2025 16:21:03
Matthias Kästner
ich möchte am Ende meiner Tabelle ein Messpunktlage Diagramm einfügen wie auf den Bild zu sehen.
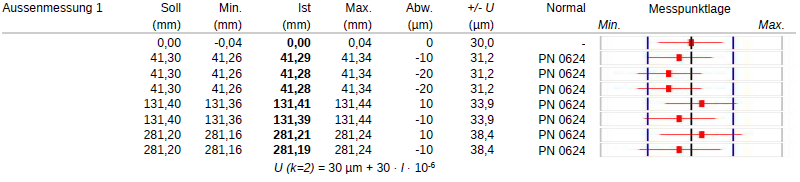
Ich habe es jetzt schon mit Gemini und Copilot probiert und bekomme es nicht hin. Das ist der aktuelle Status über VBA.
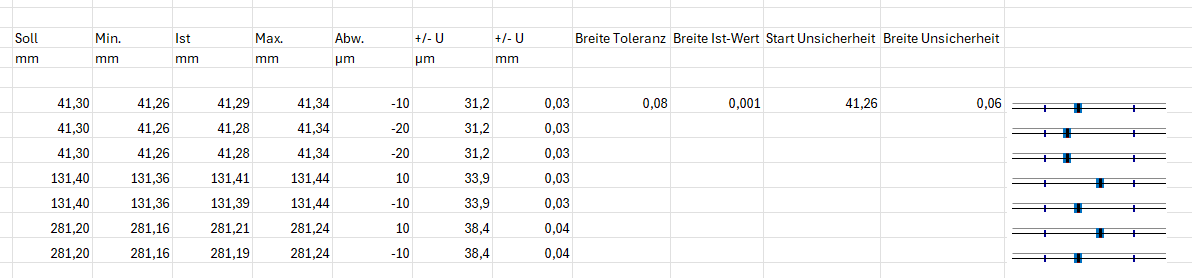
Ich möchte eine Zeilen höhe von 15, Gemini sagt ich muss 19 mindestens nehmen, aber auch dann sieht es nicht so aus wie auf Bild 1.
Der VBA Code lautet:
Option Explicit


' ===== FESTE EINSTELLUNGEN =====

Const MAIN_SHEET As String = "Test"

Const FIRST_DATA_ROW As Long = 11

Const CHART_LEFT_COL As Long = 14

Const CHART_WIDTH As Double = 120

Const CHART_HEIGHT As Double = 19 ' Optimierte Höhe für scharfe Striche


Public Sub BuildScatterErrorCharts()

    Dim ws As Worksheet

    Dim lastRow As Long, r As Long


    ' Hilfsfunktion sicher aufrufen

    Set ws = SheetByNameSafe(MAIN_SHEET)

    If ws Is Nothing Then Exit Sub


    lastRow = ws.Cells(ws.Rows.Count, "C").End(xlUp).Row

    If lastRow  FIRST_DATA_ROW Then Exit Sub


    DeleteChartsOnRight ws


    For r = FIRST_DATA_ROW To lastRow

        If NzDbl(ws.Cells(r, "D").value) > 0 Or NzDbl(ws.Cells(r, "E").value) > 0 Then

            CreateErrorBarChart ws, r

        End If

    Next r

End Sub


Private Sub CreateErrorBarChart(ws As Worksheet, ByVal r As Long)

    Dim minVal As Double, maxVal As Double, istVal As Double, uMM As Double

    Dim co As chartObject, ch As Chart


    ' Daten einlesen

    minVal = NzDbl(ws.Cells(r, "D").value)

    istVal = NzDbl(ws.Cells(r, "E").value)

    maxVal = NzDbl(ws.Cells(r, "F").value)

    uMM = NzDbl(ws.Cells(r, "H").value) / 1000#


    Set co = ws.ChartObjects.Add( _

        Left:=ws.Cells(r, CHART_LEFT_COL).Left + 2, _

        Top:=ws.Cells(r, CHART_LEFT_COL).Top + 1, _

        Width:=CHART_WIDTH, Height:=CHART_HEIGHT)


    Set ch = co.Chart

    ch.ChartType = xlXYScatter


    ' 1. HORIZONTALE BALKEN (Toleranz & Unsicherheit)

    ' Blaue Toleranz

    AddHorizontalRange ch, istVal, minVal, maxVal, RGB(0, 112, 192), 6

    ' Rote Unsicherheit

    AddHorizontalRange ch, istVal, istVal - uMM, istVal + uMM, RGB(255, 0, 0), 2.5


    ' 2. VERTIKALE STRICHE (Begrenzungen wie Bild 1)

    AddVerticalStrich ch, minVal, RGB(0, 0, 150), 1.5, 0.6

    AddVerticalStrich ch, maxVal, RGB(0, 0, 150), 1.5, 0.6

    AddVerticalStrich ch, istVal, RGB(0, 0, 0), 2.2, 0.85


    ' --- OPTIK & ACHSEN ---

    ch.HasLegend = False: ch.HasTitle = False

    ch.ChartArea.Format.Line.Visible = msoFalse


    With ch.Axes(xlCategory)

        .MinimumScale = minVal - 0.03

        .MaximumScale = maxVal + 0.03

        .TickLabelPosition = xlTickLabelPositionNone

        .MajorTickMark = xlTickMarkNone

        .Format.Line.Visible = msoFalse

    End With


    With ch.Axes(xlValue)

        .MinimumScale = 0: .MaximumScale = 2

        .TickLabelPosition = xlTickLabelPositionNone

        .Format.Line.Visible = msoFalse

    End With


    ' PlotArea dehnen

    On Error Resume Next

    With ch.PlotArea: .Top = 0: .Left = 0: .Width = co.Width: .Height = co.Height: End With

    On Error GoTo 0

End Sub


' ==== UNVERZICHTBARE HILFSFUNKTIONEN ====


Private Sub AddHorizontalRange(ch As Chart, ist As Double, vMin As Double, vMax As Double, col As Long, w As Double)

    Dim s As Series: Set s = ch.SeriesCollection.NewSeries

    s.xValues = Array(ist): s.Values = Array(1)

    s.MarkerStyle = xlMarkerStyleNone

    s.HasErrorBars = True

    With s.ErrorBars

        .EndStyle = xlNoCap

        s.ErrorBar Direction:=xlX, Include:=xlBoth, Type:=xlCustom, _

                   Amount:=Abs(vMax - ist), MinusValues:=Abs(ist - vMin)

        With .Format.Line: .ForeColor.RGB = col: .weight = w: End With

    End With

End Sub


Private Sub AddVerticalStrich(ch As Chart, xPos As Double, col As Long, w As Double, h As Double)

    Dim s As Series: Set s = ch.SeriesCollection.NewSeries

    s.xValues = Array(xPos): s.Values = Array(1)

    s.MarkerStyle = xlMarkerStyleNone

    s.HasErrorBars = True

    With s.ErrorBars

        .EndStyle = xlNoCap

        s.ErrorBar Direction:=xlY, Include:=xlBoth, Type:=xlFixedValue, Amount:=h

        With .Format.Line: .ForeColor.RGB = col: .weight = w: End With

    End With

End Sub


Private Sub DeleteChartsOnRight(ws As Worksheet)

    Dim co As chartObject

    For Each co In ws.ChartObjects

        If co.Left >= ws.Cells(1, CHART_LEFT_COL).Left - 5 Then co.Delete

    Next co

End Sub


Private Function NzDbl(v As Variant) As Double

    If IsError(v) Then NzDbl = 0# Else If IsEmpty(v) Or v = "" Then NzDbl = 0# Else NzDbl = CDbl(v)

End Function


Private Function SheetByNameSafe(ByVal sName As String) As Worksheet

    On Error Resume Next

    Set SheetByNameSafe = ThisWorkbook.Worksheets(sName)

    On Error GoTo 0

End Function
Könnte mir eventuell jemand helfen?
Viele Grüße
Anzeige